A Gantt chart is a widely used tool in project management that displays tasks in terms of time and is used to visualize project plans and monitor progress.
Gantt charts are particularly suitable for projects with fixed deadlines and several tasks running in parallel.
Their structure allows teams to plan, monitor and successfully complete their work efficiently.
The origins of the Gantt chart go back to the harmonogram developed by Polish engineer Karol Adamiecki in 1890, which led to significant performance improvements in various industries.
Around 20 years later, the American engineer Henry Gantt took up this concept and developed it further.
He created diagrams that recorded the progress of workers in the execution of tasks so that supervisors could quickly recognize whether production plans were behind, ahead or on schedule.
These charts were primarily used to plan machine assignments and order sequences.
Since then, the Gantt chart has become an indispensable tool for project managers worldwide.
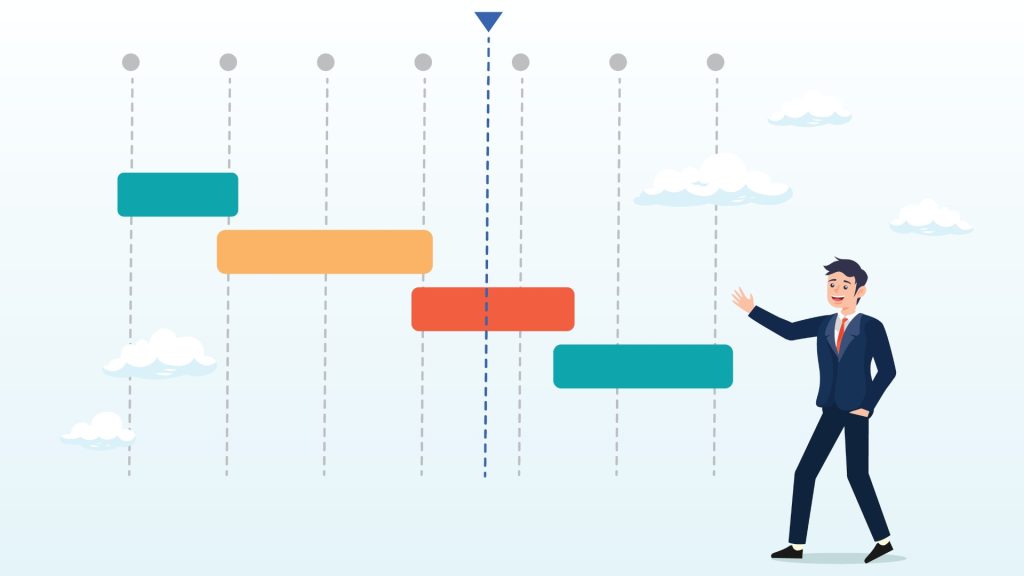
Structure of a Gantt chart
A Gantt chart graphically represents the timeline of a project and links it to the individual tasks. It consists of two main components:
- Timeline (horizontal): This axis shows the entire project period, divided into days, weeks or months – depending on the complexity and length of the project.
- Task list (vertical): This axis lists all project tasks or milestones in a structured manner that must be fulfilled in order to complete the project.
A Gantt chart also includes other key components that enable clear and effective project planning:
- Dates: The dates mark the start and end time of the entire project. They provide a clear overview of when the project starts and when it should be completed.
- Tasks: A project is made up of several subtasks. Each task is displayed as a bar, the length of which indicates the duration of the task. The start and end of the bar show the start and end time of the respective task.
- Estimated time frame: This shows how much time is scheduled for each task and helps to ensure that all tasks are completed on time. This also allows the scheduled completion of the entire project to be monitored.
- Dependencies: Some tasks can only begin after other tasks have been completed. These dependencies are shown in the Gantt chart to facilitate the control flow and ensure that the project progresses efficiently.
There are a total of four different relationships for task dependencies:
- End-to-start: This is the classic relationship in the critical path, where a task can only begin once the previous one has been completed.
- End-to-end: A task can only be completed when another task has also been completed.
- Start-to-start: A task can only start when another task has already been started.
- Start-to-finish: A task can only be completed once another task has started. This relationship is the opposite of the end-to-start connection and rarely occurs.
- Progress: The progress of the tasks can be visualized by colouring the bars. This makes it possible to see at a glance how far the project has progressed and which tasks have already been completed.
- Current date: A vertical line marking the current date runs across the entire diagram. It gives a clear overview of where the project is in the schedule and helps to monitor progress.
Advantages of Gantt charts
Gantt charts offer several decisive advantages for project management:
Visual clarity: Gantt charts provide a clear, graphical representation of tasks, schedules and dependencies that can be understood at a glance.
The visual structure makes it immediately clear which tasks need to be completed when and how they are connected.
This makes it easier for all team members to understand and ensures transparency in the project process.
Effective time management: Project managers and teams keep track of the schedule.
It is clear which tasks are due, how long they will take and when they need to be completed.
This helps to continuously monitor progress and ensure that the project is completed on time.
Delays can be identified at an early stage and countermeasures can be initiated.
Targeted communication: Gantt charts improve communication within the team and with external stakeholders.
Thanks to the clear presentation of the entire project, everyone involved can see the current status at any time and understand which dependencies exist.
This promotes targeted and efficient communication, as misunderstandings and ambiguities are avoided.
Resource planning: By clearly showing the duration and sequence of tasks, a Gantt chart makes it easier to plan and allocate resources efficiently.
This allows personnel, budget or materials to be planned in a targeted manner, which helps to avoid overloads and ensure that all required resources are available at the right time.
Planning flexibility: Gantt charts offer planners the flexibility to adjust the course of the project if necessary.
If framework conditions change or unexpected problems arise, tasks can be reprioritized, postponed or restructured.
These adjustments are immediately visible in the diagram, allowing the entire team to stay up to date and adapt to new requirements.
Identification of bottlenecks: A key benefit is the early identification of critical tasks and potential bottlenecks.
Tasks that could delay the entire course of the project are highlighted so that measures can be taken at an early stage to avoid delays.
This helps to minimize the risk of project overruns and ensure the success of the project.
Gantt charts in the waterfall and agile approach
Waterfall method and Gantt charts: In the waterfall model of project planning, a linear approach is followed in which stakeholder and customer requirements are collected at the start of the project.
On this basis, project managers create a sequential project plan with clearly defined milestones and deadlines.
Each stage of the project builds on the completion of previous tasks.
This model is particularly suitable for teams focusing on fixed processes, such as in construction or manufacturing, as the individual steps need to be planned in detail in advance.
Gantt charts are a preferred tool in this method as they clearly show the sequential progress and dependencies between tasks.
Agile method and Gantt charts: In contrast, the Agile method focuses on flexibility and adaptability.
Instead of creating a complete timeline with fixed deadlines, agile teams break projects down into smaller, manageable iterations, known as sprints.
At the beginning of a sprint, the team focuses on specific project goals for the coming weeks.
At the end of a sprint, the results are evaluated and incorporated into the planning of the next sprint.
A Gantt chart can help to visualize how changes to a task could affect the overall plan or the product roadmap.
This is particularly important for agile teams, as continuous feedback from stakeholders is a central component of the methodology.
How do you create a Gantt chart?
- Identify the tasks: The first step in creating a Gantt chart is to identify all the tasks or milestones required to complete the project.
The entire project should be broken down into manageable subtasks.
This level of detail ensures that no important work steps are overlooked and that each task is clearly defined.
It is important to consider smaller tasks as well, as they are often crucial to the overall progress.
Thorough task identification lays the foundation for successful project planning.
- Determining the duration: Once the tasks have been identified, the expected duration is estimated for each task.
This estimate is based on empirical values, historical data or expert estimates and should be as realistic as possible.
It is also advisable to allow for buffer times to compensate for unforeseen delays.
Specifying the exact duration of each task helps to determine the overall timeframe of the project and ensure that all activities can be completed on time.
- Definition of dependencies: A key aspect of project planning is determining dependencies between tasks.
Some tasks can only be started once others have been completed, while some can run in parallel.
It is important to identify these dependencies precisely and determine the order in which the tasks must be carried out.
By defining dependencies, the control flow of the project is clearly structured, avoiding bottlenecks and increasing efficiency.
- Creation of the diagram: The next step is to create the Gantt chart.
To do this, the previously identified tasks are listed on the vertical axis of the diagram.
Each task is drawn as a bar, the length of which reflects the duration of the task.
The position of the bar on the time axis shows the start and end of the respective task.
Dependencies between the tasks are illustrated by arrows or lines.
The result is a visual representation of the entire project plan that shows at a glance the sequence and time frame of the project.
- Monitoring and adjustment: A Gantt chart is not only a planning instrument, but also a tool for monitoring the progress of the project. As the project progresses, the chart should be updated regularly to track the actual progress of tasks. In the event of delays or changes to the framework conditions, adjustments should be made to keep the project plan on track. This continuous monitoring and adjustment makes it possible to identify problems at an early stage and manage the project flexibly. By updating the Gantt chart, the entire team is always kept up to date and can react effectively to changes.
Create Gantt charts with project management tools
Gantt charts were originally created on paper, but with the introduction of computers in the 1980s, they became increasingly complex and sophisticated.
Today, specialized project management tools make it much easier to create, update and monitor these diagrams.
Tools such as Atlassian Jira or Trello offer user-friendly interfaces that enable teams to plan and manage their projects in real time.
These software solutions allow tasks to be moved flexibly, dependencies to be calculated automatically and progress to be tracked visually.
Create a Gantt chart with Atlassian Jira
To meet the requirements of modern software development, roadmap tools such as Jira offer functions such as a hideable task structure and views for resource management. These features help teams maintain a consistent project strategy despite the iterative nature of software development processes. Jira includes two roadmap tools that can be used to create Gantt charts for projects: The Timeline view allows you to create plans for Jira tasks assigned to a specific team, while the Plans view provides the same functionality for all teams and organizations.
- Project-specific diagrams – Jira timelines: The screenshot shown here from the “Timelines” view illustrates a project-specific Gantt chart that is often used at team level or within individual departments. This chart shows how the team is working towards its goals, while a hideable work breakdown structure helps project managers keep track of important project stories. Jira offers a free project management template that already integrates Gantt charts.
- High-level organization chart – Plans: The timeline view allows for quick and easy planning, helping teams to efficiently manage dependencies and track progress in real time.
These roadmaps, used at the project or team level, are particularly useful for planning large-scale tasks.
Plans are recommended for planning, managing and tracking tasks that need to be coordinated across teams or organizations.
Programs with cross-team workflows offer advanced tools such as capacity management and automatic scheduling features that enable the creation of more complex plans. They also offer flexible view settings that allow you to customize your Gantt chart to highlight certain aspects of your plan during presentations.

Create a Gantt chart with Atlassian Trello
Trello, known for its flexible Kanban boards, can be extended with power-ups to integrate Gantt charts and optimize project planning. Here are some of the best options for using Gantt charts in Trello:
- Planyway: With the Planyway Power-Up, you can view your project in different views, whether by team members or lists, using the Team Timeline feature. Planyway seamlessly synchronizes your Trello cards and lists so that all project updates and due dates are immediately mirrored in the Planyway interface.
- TeamGantt: The TeamGantt Power-Up offers a user-friendly way to create Gantt charts for your projects. With TeamGantt, you can choose which project you want to display in Gantt format and decide whether you want to combine multiple cards into one chart or combine multiple boards into one Gantt chart.
- Placker: The Projects by Placker Power-Up is a comprehensive project management solution that includes a flexible Gantt chart. Placker allows you to plan cards and checklists across one or more boards, create dependencies between cards and checklists to visualize the critical path, set baselines and control resources. Placker is seamlessly integrated with Trello so that updates to Trello cards are automatically reflected in the Gantt chart and vice versa.
(lb/jodocus)